Ecommerce Analytics Compared: What Actually Works?
With dozens of tools and metrics to choose from, ecommerce analytics can feel overwhelming. This guide breaks down what truly drives ROI.
So, knowing the ins and outs of your analytics is crucial because without a robust approach to your analytics dashboard(s), you won’t know:
- How many people are visiting your store
- Where they’re coming from
- Which categories and products they frequent
- What the average buyer journey looks like
- Whether your paid ads are making an impact
- And so much more.
Once you master eCommerce analytics, you'll know what encourages customers to click “Buy Now”, and what pushes them to close the tab altogether. So, we’ve put this comprehensive guide together to help you become a data-crunching machine.
Key takeaways
- Understanding Key eCommerce Metrics: Focus on five crucial metrics: Audience, Acquisition, Behavior, Conversions, and Paid Marketing activities to track and optimize store performance.
- Common Google Analytics Mistakes: Avoid errors like data discrepancies, not reversing test orders, inaccurate data sampling, and duplicate transactions to maintain reliable analytics.
- Optimizing Google Analytics Setup: Ensure proper configuration through Google Tag Manager, Site Search tracking, checkout tracking, and filtering bots to gather accurate insights.
- Use Standard and Enhanced Reports: Leverage both standard (e.g., eCommerce conversion rate) and enhanced (e.g., product performance) Google Analytics reports for a comprehensive view of customer behavior and sales data.
On this page:
The 5 types of eCommerce metrics you must know about
When it comes to knowing which eCommerce metrics to analyze, here are the fundamentals that we’ll be building on in this article.
1. Audience
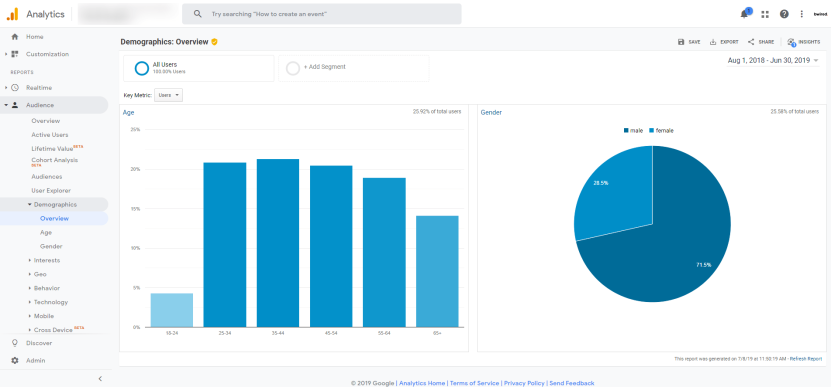
Analytics information about your target audience provides you with insights into your customers' geographic location, age, gender, and perhaps their interests or product preferences.
2. Acquisition
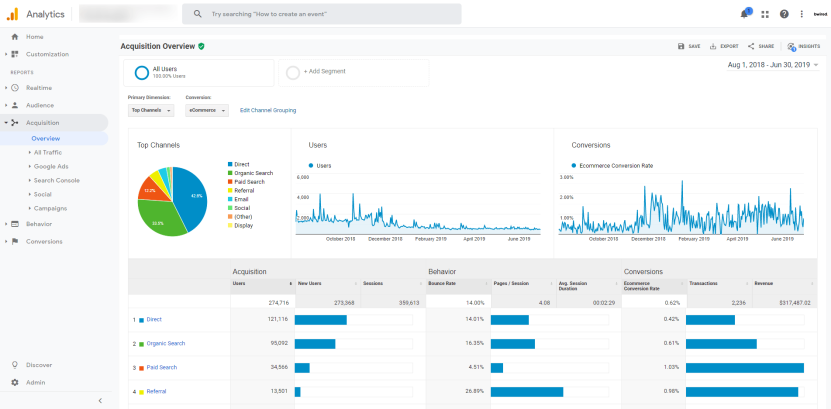
This data informs you how exactly your customers found your store, and how they arrived at your site. This information indicates which marketing channels your brand should focus on.
3. Behavior
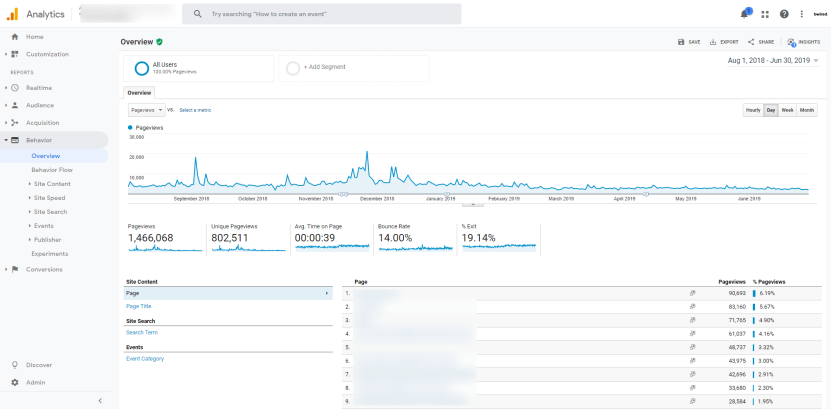
This data shows you how your customers respond to information on your eCommerce site. Customer behavior relates to the content customers click, the products that interest them, and what they buy. The data could include how long customers spend before making a purchase or leaving the site.
4. Conversions
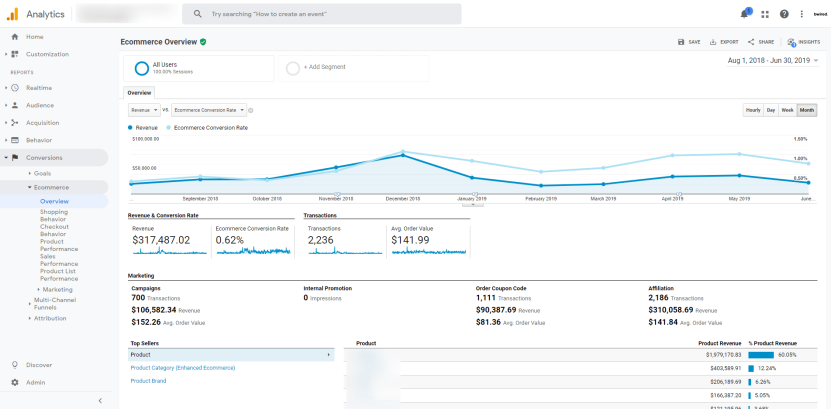
Conversion data refers to the point when an online user turns into an actual customer. You should track conversion data over time and identify when conversion rates increase, decrease, and the potential causes.
5. Paid marketing activities
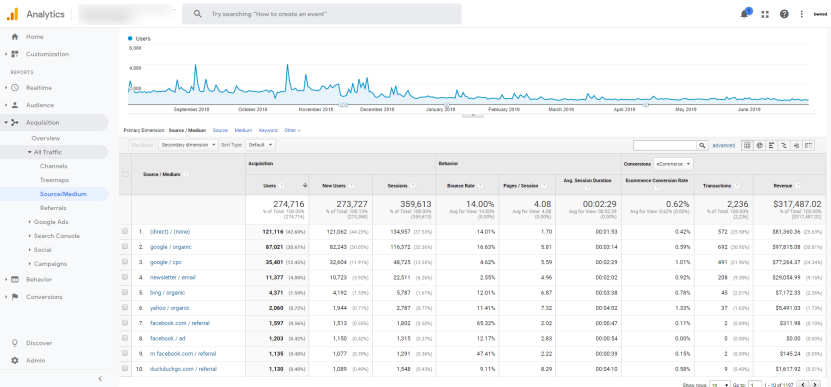
When you use paid ads to boost web traffic, you need to gather data from these platforms (Facebook Ads, Instagram Ads, etc) to determine the ROI.
4 common Google Analytics mistakes: eCommerce edition
Before we delve into our eCommerce analytics checklist, here are four common eCommerce mistakes we see far too often within Google Analytics dashboards. If you’re making any of these mistakes, then you already know where your eCommerce analytics strategy needs attention most urgently.
1. Data discrepancies between Google Analytics, sales data, and shopping cart data
Pre-built shopping carts handle unfulfilled orders, cancelled orders, refunds, and test orders. Google Analytics (GA) does not come with such a feature. GA tracks when a user visits a confirmation page, but GA doesn't record cancelled orders or refunds. This leads to discrepancies in the GA eCommerce reports. It's important to remember that GA is an analytics platform, not accounting software.
eCommerce platforms can handle sales information better than GA, so we advise that you rely on your eCommerce platform’s data more.
2. Running test orders without reverting them in Google Analytics
Before you launch an eCommerce website or application, it's good practice to run test orders. When developers run test orders, sometimes they're are not reversed on Google Analytics. If you don’t reverse them, you're inflating your sales data.
Work with your developers to make sure you deduct all test orders from your analysis.
3. Data sampling can lead to inaccuracy
Data sampling is selecting a subset of traffic data for analysis. It's used in statistical analysis to analyze large data sets. Google Analytics has a limit on data sampling, so you can't produce reports on large data sets.
Even if you manage to run a data sampling below the GA threshold, you could risk skewing your eCommerce data. According to Optimize Smart, eCommerce data could be off the mark by 10 to 80%.
Shorten the data range to stay under the sampling limit or use default reports that are not subject to sampling.
4. Duplicate transactions
Duplicated transactions are a common issue. A duplicate transaction happens when the tracking code is executed more than once without a new order being placed. Having a lot of duplicate transactions can reduce the value of your sales data.
Ensure visitors cannot access the order confirmation page more than once without submitting a new order or disable the tracking code from being executed on reload or refresh.
eCommerce analytics checklist: Time to own your eCommerce analytics strategy
We broke this checklist into 3 sections:
- Configuring Google Analytics for eCommerce
- Essential eCommerce metrics and reports provided by Google Analytics
- Social media tracking for eCommerce
How to configure Google Analytics for eCommerce
While Google Analytics is an excellent tool, there are several configurations you need to make so you can get the best out of it. Let’s take a look at the most important actions you should take to get the most out of the tool.
1. Set up your Google Analytics in Google Tag Manager
Google Tag Manager (GTM) is a free tool for deploying tracking and remarketing code in a simple interface. The tool removes the need for developers to add or remove pixels. Marketers have control to add or remove pixels without having to know any JavaScript, PHP, or HTML.
- Sign up for GTM and specify where the container will be used
- Create a new tag
- Enter your GA tracking code and tracking type
- Set the trigger for “All Pages”, so the tag fires on every page visit
2. Register and verify your site with Google Search Console
From an SEO perspective, having a Google Search Console (GSC) account is essential because it can help monitor your website’s status, “crawlability”, and keyword ranking on Google.
- Register your eCommerce site’s domain
- Verify the domain through either GTM or GSC
- Upload an XML sitemap so Google can index your site faster.
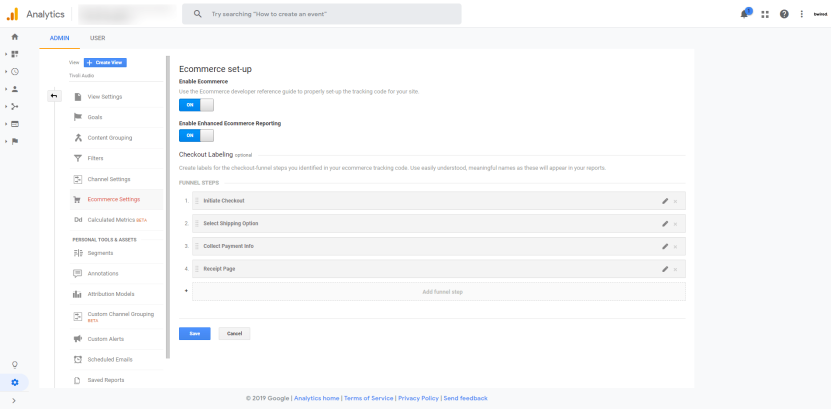
3. Verify checkout tracking
One common reason that cart abandonment happens has to do with the checkout process. According to the Baymard Institute, 28% of users abandon cart due to a long or complicated checkout process.
Checkout tracking is essential for understanding when users drop out of the process. Track each stage of the checkout section by ensuring each page of the process has a distinct URL. For example:
- Checkout/Cart detail page: www.samplestore.com/checkout/cartreview
- Delivery and Shipping page: www.samplestore.com/checkout/delivery-shipping
- Payment Info page: www.samplestore.com/checkout/payment
- Thank you/Confirmation page: www.samplestore.com/checkout/order-confirmation
4. Enable site search
Knowing what your customers search for on your eCommerce site is golden because it helps you to find specific keywords that keep popping up and allows you to unearth new search terms.
Google Analytics provides you with a report of the keywords your visitors. Whenever users search your site, the search queries are in the URL.
For example, if your users wanted to search for “Metal Reusable Water Bottles,” the URL will show the following:
https://samplesite.com?hl=en&q=metal+reusable+water+bottle
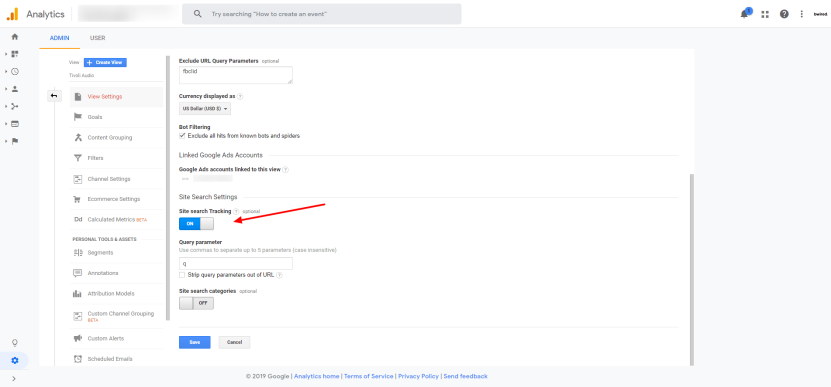
- Go to your Analytics account
- Set Site Search Tracking on under Admin > View Settings > Site Search Settings
5. Customize tracking campaigns
By default, Google Analytics segments your incoming traffic from multiple sources and channels. Here’s Google Analytics’ default channel grouping:
- Direct: Customers access your site by typing in your web address into their browser.
- Organic Search: Traffic via organic search engine results.
- Paid Search: Traffic via a paid search engine ad, like Google Ads.
- Display: Traffic via a display, banner or content ads.
- Social: Customers came to your site via social media, or from a campaign that has been tagged as social media.
- Email: Visitors that came to the site via a link embedded in an email campaign.
- Affiliate: Customers came across your site or brand via an affiliate campaign.
- Referral: Customers access your site via a review article or coverage by a news outlet.
Occasionally, Google Analytics will incorrectly classify your traffic within the groups shown above, or the traffic doesn’t fall into any of the categories.
But, you can set Google Analytics to classify your traffic by using URL Query String Tags. This helps you capture additional traffic from PDFs, dark social sharing, HTTP to HTTPS redirections, and more.
6. Filter bots and spiders
Non-human traffic like bots can inflate your metrics and lead to data inaccuracies. To resolve this issue, you need to filter out traffic from bots.
- Navigate to Bot Filtering in View Settings,
- Tick the checkbox that reads “Exclude all hits from known bots and spiders”
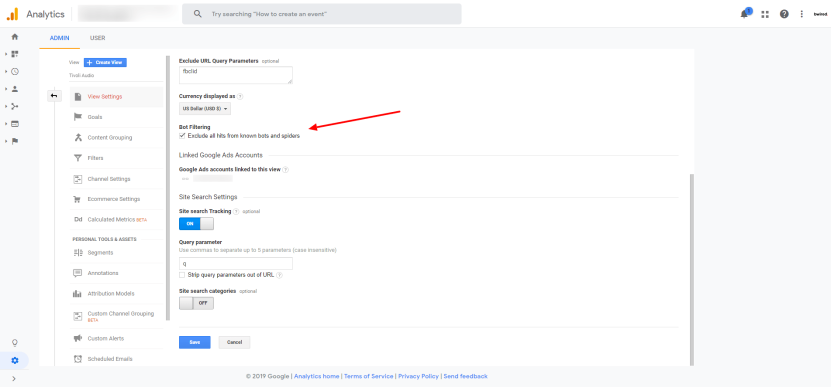
When you check that box, your Google Analytics will filter all known bots and spiders.
The essential Google Analytics metrics and reports for eCommerce
Once you have configured Google Analytics, you can access several eCommerce metrics. There are two types of eCommerce analytics reports:
- Standard: See basic data like conversions, average order value, products, and transactions.
- Enhanced: See standard report data, which items are added to carts, and shopping behavior.
Now, let’s take a look at what eCommerce metrics Google Analytics provides.
1. The standard metrics
These are the metrics that you can get from Google Analytics Standard Report:
- eCommerce Conversion Rate: Total eCommerce Transactions/Total Sessions x 100
- eCommerce Transaction: Total number of purchases ordered on the site.
- eCommerce Revenue: Top line revenue during a specified time period. This figure may include tax and shipping, but this depends on how it has been set.
- Average Order Value: Total Revenue/Total Transactions
2. The enhanced eCommerce metrics
Enhanced Ecommerce gives a better picture of the customer journey. You can view the “Enhanced” reports via the left-hand menu of the Google Analytics’ dashboard.
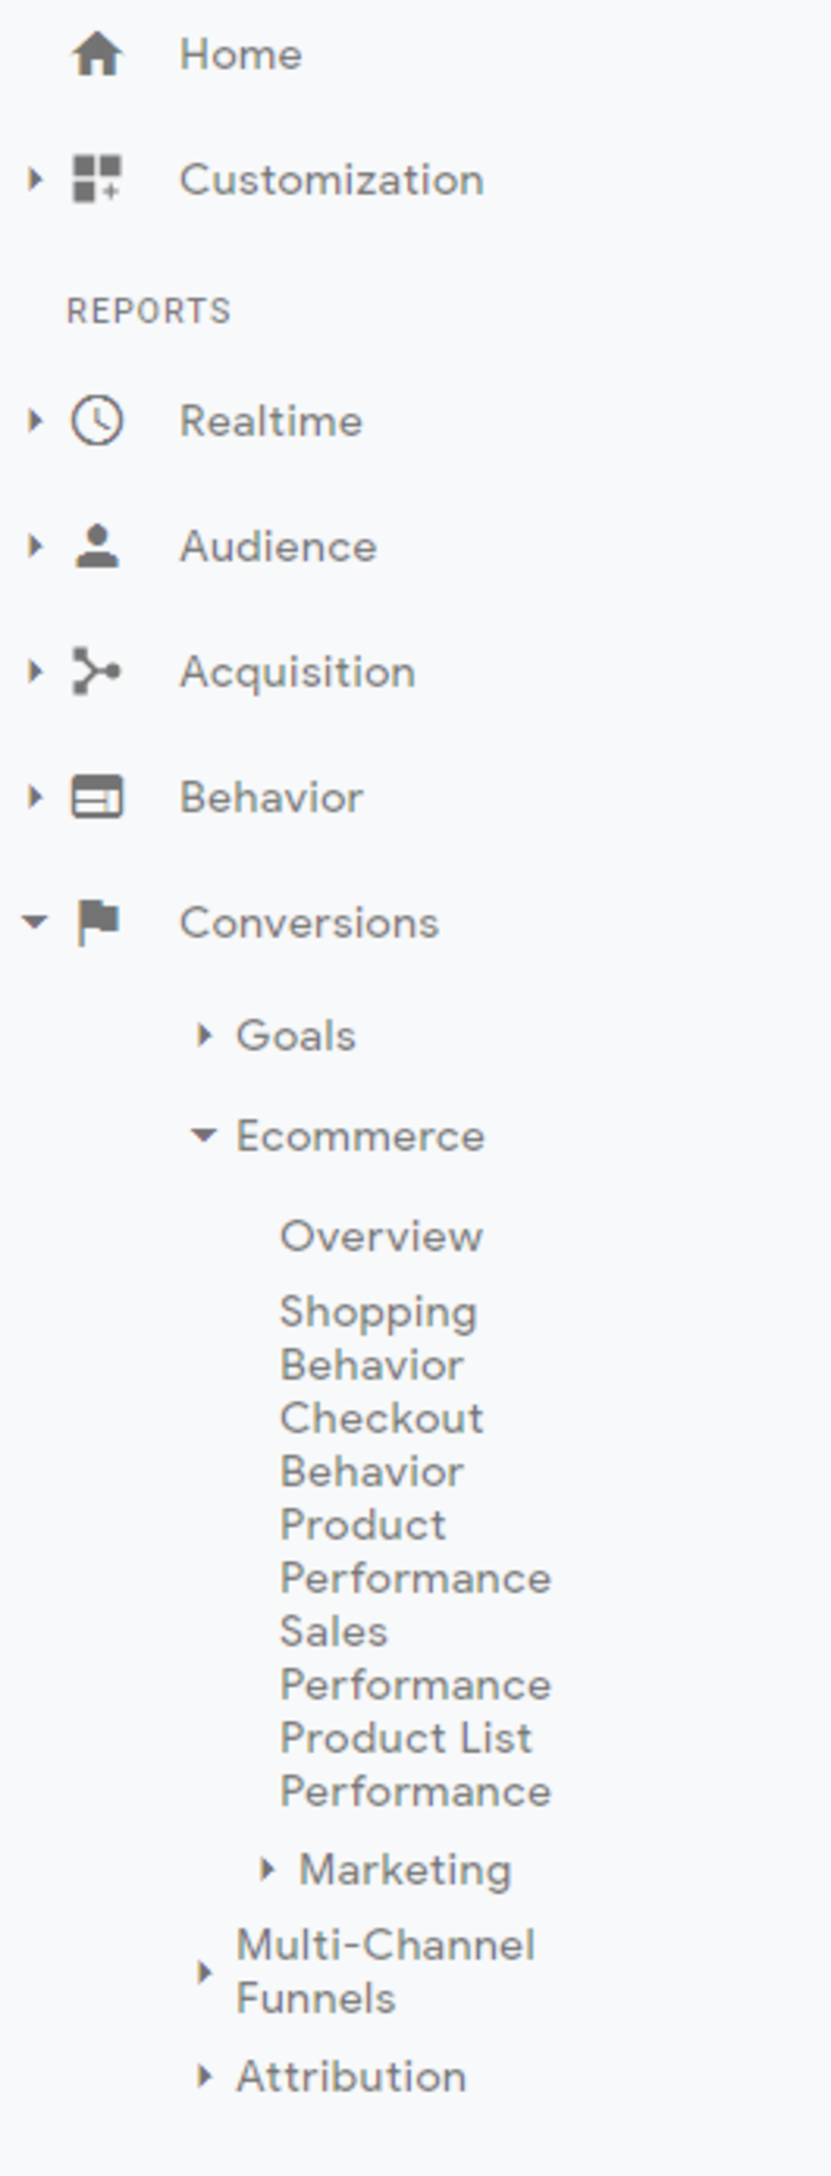
Here’s a look at some of the enhanced reports available:
Overview
As the name suggests, the overview provides a view of your overall performance. This includes the standard metrics like conversion, average buyer rate, revenue, and more.

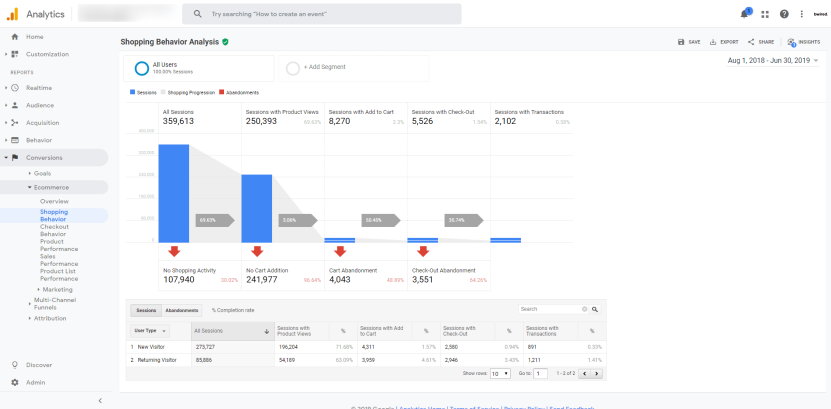
Shopping Behavior report
The Shopping Behavior report provides a visualization of consumer behavior on your website. It shows you a horizontal funnel of what consumers are doing on your site from adding products to the shopping cart to completing a purchase.
The funnel can show different dimensions such as device category, browser, and country so you get a better understanding of how optimized your funnel is at each stage of the process.
You can also measure the number of “No Cart Additions” or “Cart Abandonment” to see what’s not working.
Checkout Behavior report
The Checkout Behavior Report is a visualization report that zooms in on the checkout process.
Like the Shopping Behavior report, you can view how many users made it through each step of the process, and where the most drop-offs occur.

Product Performance report
This report provides a look into how your products are performing at a granular level. Metrics in this report include product revenue, average price, and unique revenue. There are some metrics, however, that are only available in the enhanced reports.
In the enhanced reports, the cart-to-detail rate shows the percentage of users who have added items to the cart against those viewed it on the site.
The buy-to-detail rate is the percentage of users who purchased a product against those that viewed it. You can also filter the report by product category, product SKU, and the name of the brand.

Product List Performance report
This report presents a logical grouping of your products based on tags or categories. These groups can represent catalog pages, up-sell blocks, and search result pages.
You can also optimize your product lists to determine which groups attract the most clicks, or generate the most revenue.
Tracking your social media marketing campaigns for eCommerce
Most eCommerce traffic comes from platforms like Facebook and Instagram, so it's essential to set up social media tracking. In fact, Shareaholic states that social media is a significant driver for eCommerce traffic.
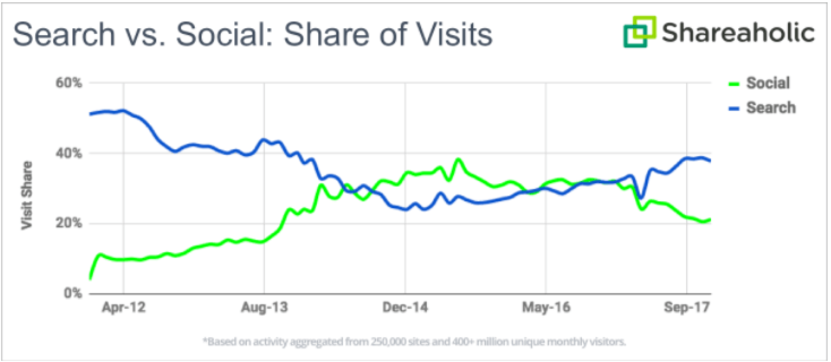
(Search vs social traffic | Source)
To make sure you get a complete picture, you need to measure how your consumers or visitors are interacting with your business on social media.
Metrics include how many clicks before they buy, and the cost of acquiring customers from each channel. Most social media platforms provide analytics tools to assess your brand’s performance.
Facebook Analytics
As the largest social media platform, with over 2.27 monthly active users, Facebook has a wealth of analytics tools at your disposal.
How to set up Facebook Analytics
To set up Facebook Analytics, you need to create Facebook Events. Events are snippets of code, which you add to a Facebook Pixel to inform Facebook when an event occurs.
For instance, you can create a “Purchase” event, and embed it in the checkout confirmation page to signify a purchase occurred. Other events you can create are:
- Add to Cart
- Search
- View Product Page
- Add Payment Info
- Registration
Facebook Analytic reports
Once events have been set up, Facebook Analytics can gather data from these to create a report. There are many reports available on Facebook Analytics, here are a few that you need to be on top of:
1. Funnel report
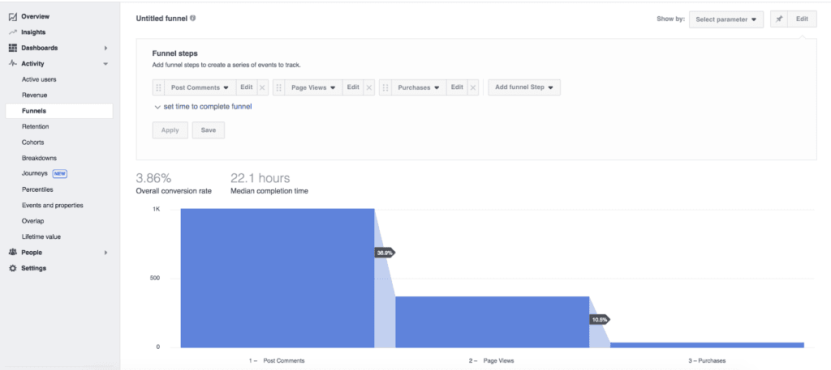
(Facebook funnel report | Source)
Facebook Analytics Funnel provides valuable insight into the actions your visitors are taking, and which actions are most valuable for your bottomline.
These actions include purchases, becoming a subscriber, or visiting your online store. Once you set up the funnels and start tracking data, if Facebook visitors post comments on your page, you'll know how many of these “commenters” buy something on your site.
You can also do this for post reactions (likes and emoji reactions), messages sent, and post shares. You can even assign values to different actions so you can get an idea of how much each action is worth.
2. Customer Lifetime Value (CLTV) report
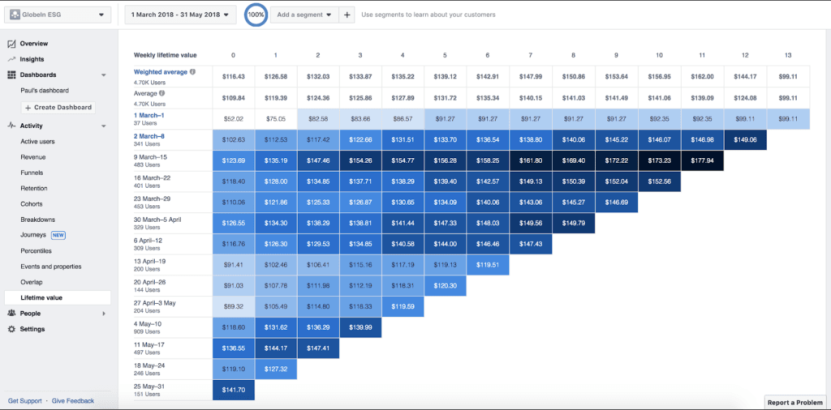
(Facebook CLTV report | Source)
The CLTV report provides information on the worth of visitors over a period of time, and how much you can afford to spend to profitably acquire new users.
You'll know how often customer buy, how long it takes, and the potential length of the relationship. Some of the most useful metrics include average revenue per user, organic and non-organic revenue, number of purchases per user, and more.
Using CLTV, you can create Lookalike audiences on Facebook to target ideal customers using your current customer data to target similar users. The tool uses data like interests, location, and more to reach new customers and re-engage existing customers.
3. Revenue report

(Facebook revenue report | Source)
The revenue section of Facebook Analytics lets you view information on purchases.
Depending on your Pixels and Events, you'll get a breakdown by purchase value. These categories include age, gender, language and location.
This report will help you better understand your most profitable market segments and enable you to adjust your marketing strategies to maximise your ROI.
Instagram Analytics
Instagram’s engagement has been measured to be 4 to 12 times higher than other social media channels. In fact, Instagram is recognized as a key player in top-of-the-funnel marketing.
To view your analytics information, you must have a business profile. Tap “hamburger” menu and then choose Insights. You will then see metrics like profile visits, website clicks, and impressions.
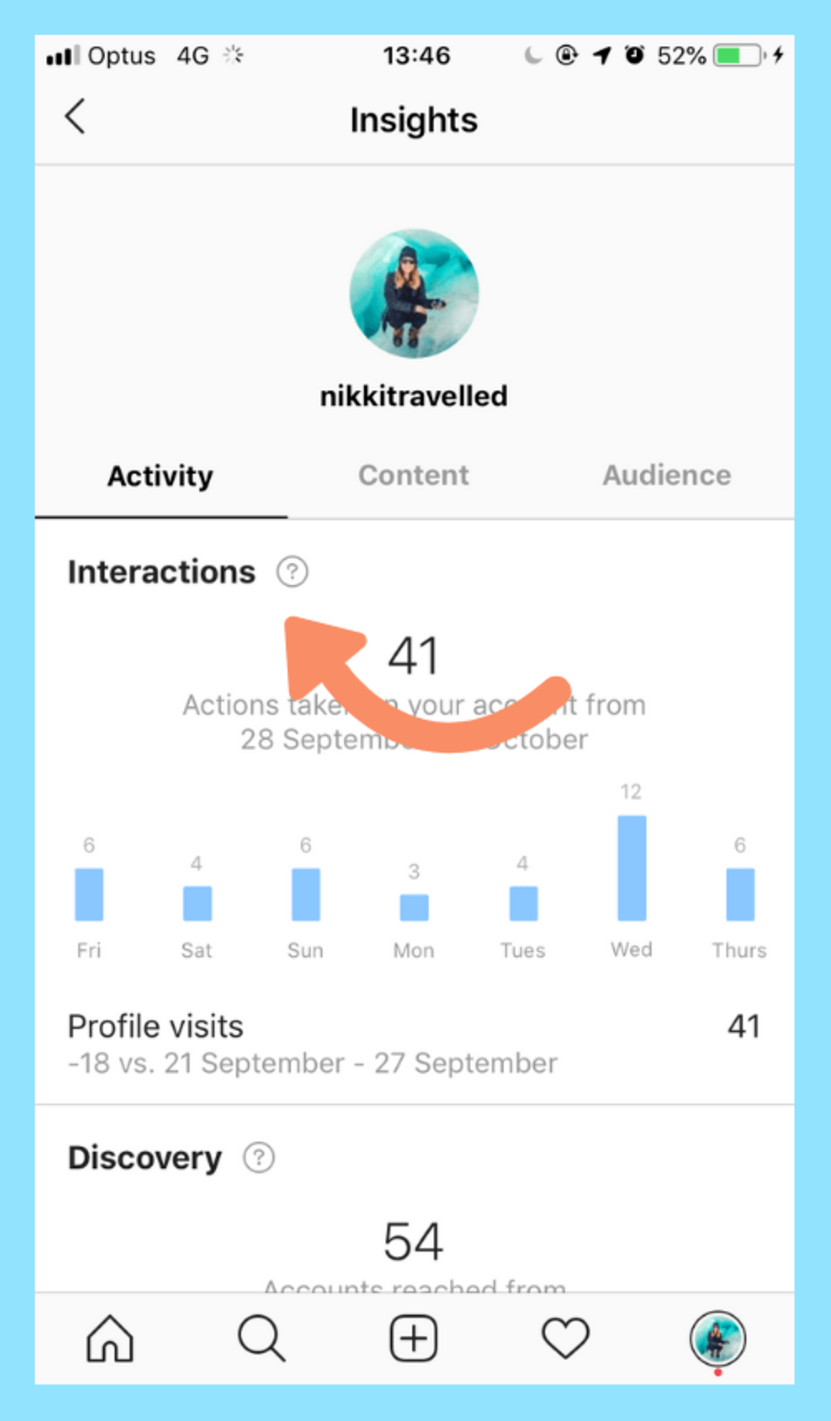
(Instagram analytics | Source)
Along with Instagram’s default analytics, the company unveiled a new feature called Shoppable Instagram Feeds. This feature enables you to tag products to your Instagram photos which can lead back to your site.

(Instagram Shoppable Post | Source)
To use this feature, you must have a Business Profile on Instagram, and the latest app. You also need a Facebook Page with a shop, and be located in one of the following countries:
- USA
- Canada
- Brazil
- UK
- Germany
- France
- Italy
- Spain
- Australia.
First, you need to connect your Facebook Shop to your Instagram. You can manually add items to the shop, or you can migrate products from your eCommerce site’s inventory to Facebook.
Once you create your Facebook shop, link it under your settings in Instagram. You can then tag your products to your images.
Additionally, you can tag your products in Instagram Stories.
Ready-made eCommerce reports you can use right now
While GA is a great tool out-of-the-box, setting up custom reports can be time-consuming.
So, to save you some time, here are some ready-made reports that you can import straight into your account.
1. Time of day/day of week transaction report
With this report, you can pinpoint which hours of the day and which day of the week has the most sales. You can also identify low sales periods and run special promotions to boost revenue.
Import the Time of Day / Day of Week Transaction Report
2. Content efficiency report
Developed by an analytics expert, this report helps you identify which content is performing well.
The report measures traffic and provides statistical information related to engagement. This includes metrics like bounce rates and the amount of time spent on the page.
Import the Content Efficiency Report
3. Referral traffic revenue opportunities report
This report allows you to discover which channels are contributing to the most sales. You can identify the exact URLs that refer traffic to your site, and analyze revenue.
Import the Referral Traffic Revenue Opportunities Report
4. Organic search eCommerce report
This custom report provides an overview of all organic search traffic. Some metrics include the number of users, their locations, and average session duration.
Import the Organic Search eCommerce Report
5. Site speed metrics report
This report shares the key metrics related to the performance of your website. The report also gives metrics for various browsers, helping you identify compatibility issues.
Get a 360-degree view with Google Analytics by integrating with other platforms
It’s important to get a full picture of your eCommerce business. You could use analytics tools separately, but we think it's better to have them all in one place.
Here are some tools you should integrate with your eCommerce analytics.
1. Tax and accounting software
Combining eCommerce analytics with tax software helps eCommerce brands with a global presence that abide by tax rules in other countries, or need to calculate sales tax by state.
For state sales tax, where items were purchased and other shipping data helps streamline tax calculations. For income tax, an integrated solution allows you to calculate your tax easier by bringing in relevant data like revenue, cost of goods sold, and more. Some great tax software to integrate with include Avalara and TaxJar.
2. CRM & email marketing software
You can tie your CLTV metric to CRM systems to identify and segment customers from previous purchasers to new subscribers.
This allows you to deliver relevant and personalized campaigns to re-engage customers that are about to churn and win them back.
You can also send product-focused campaigns during major holidays or individual customers’ birthdays to encourage new sales from already profitable customers. With the key metrics combined, you can better track which campaigns drive the most revenue.
3. CMS platform
Integrating your CMS platform with Google Analytics allows you to track what marketing campaigns drive the most revenue and engagement.
A marketer-friendly CMS, like Core dna, has a ready-made eCommerce analytics tool to optimize content marketing campaigns and increase conversions with data-driven insights. It also lets you integrate other tools mentioned on this list to create your eCommerce DXP.
eCommerce analytics: The key to eCommerce growth
As an increasing number of brands open online stores, competition is ever more fierce. Analytics help you understand your customers and stand out from the crowd. The checklist above shows that eCommerce analytics is vital for business success. If you tick a majority of the boxes and analyze all the data, you will see your eCommerce brand thrive. With so many analytics tools, you need a platform like Core dna to integrate all your tools in one place.


